
The platform now includes free Analytics* to enable administrators to view real-time use of their app.
* If this is not currently included in the menu on the portal, please contact support to request this is activated.
The page displays the following information:
- App visits
- Total users
- App messages sent last month
- News item impressions
- Calendar event impressions
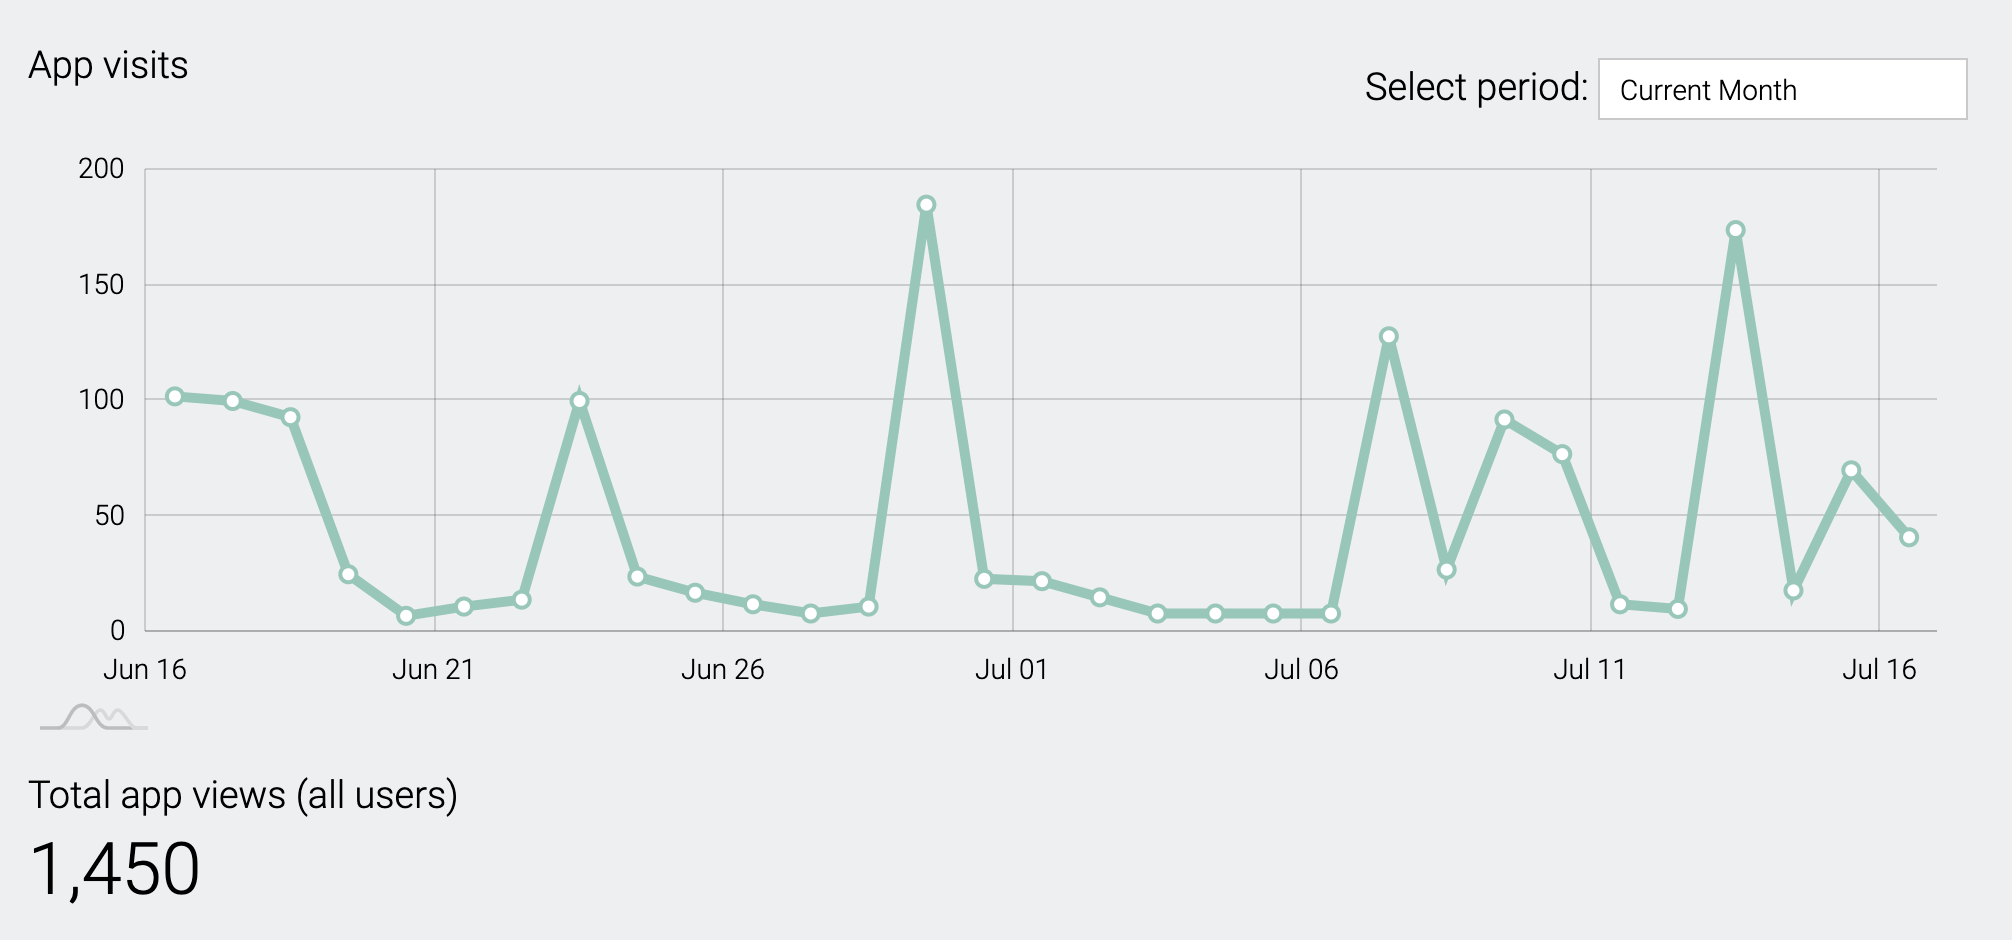
App visits
This chart shows the number of app users who have accessed your app over a period of time (current month is the default, but this can be changed) Hover over data points to see specific figures.
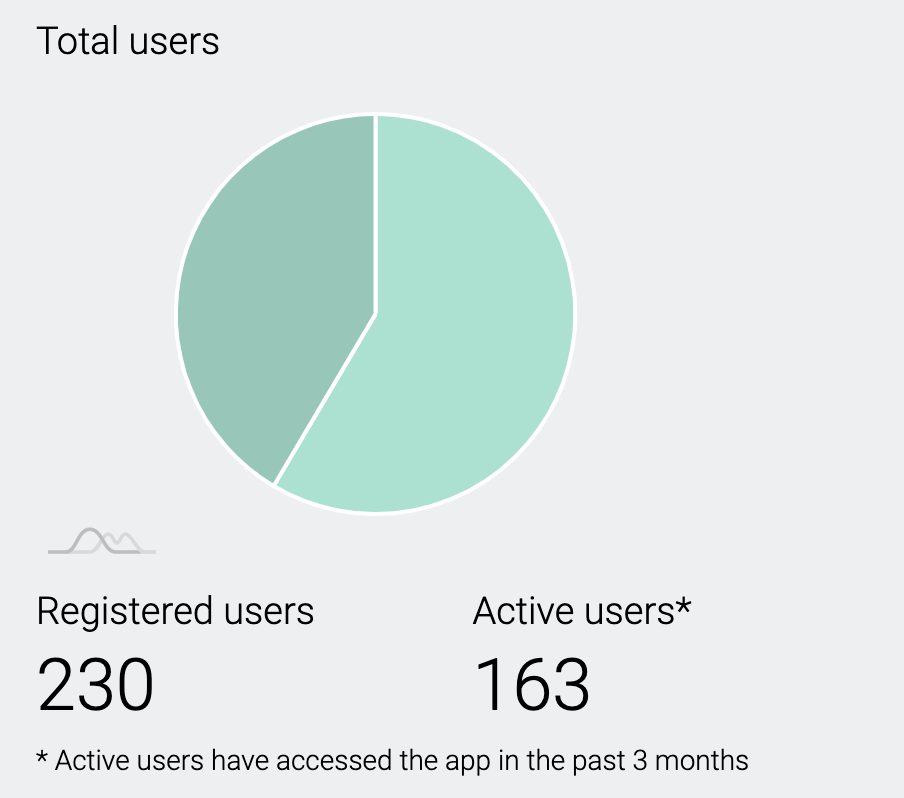
Total users
This chart shows your total registered users together with Active users, who have accessed your app in the last 3 months.
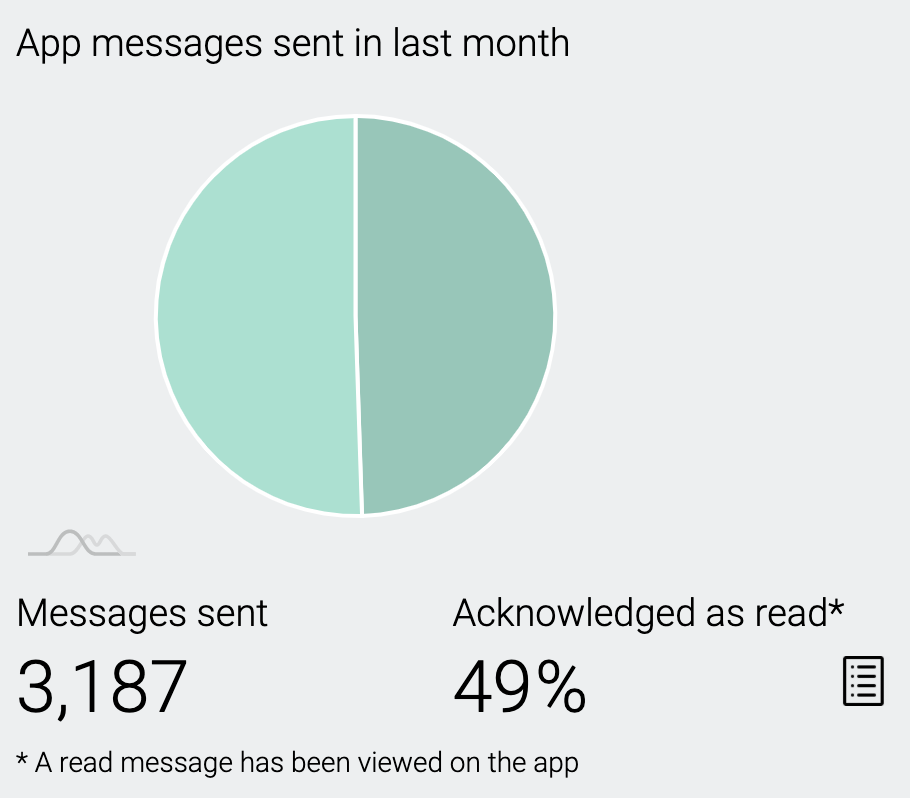
App messages sent
This chart shows the total number of app messages sent* in the last month and the number acknowledged as read, as a percentage. Clicking on the report icon ![]() will enable you to see a detailed report for each message sent.
will enable you to see a detailed report for each message sent.
A message is recorded as read when a parent opens the app, which dismisses the red 'flag' on the app tile and in the app menu. If parents only read the message in the notification pane on their phone home screen the Acknowledged percentage may be lower than expected. We are unable to verify unacknowledged reads.
* The typical cost of an 'old school' text message can be up to 5p each. So to calculate savings by using free app messaging simply multiply messages sent by 0.05 to see your savings in £s. (e.g. for the example above 3,187 x 0.05 = a saving of £159.35 in a month)

News and Calendar event impressions
These figures show the number of impressions (reads) your news and calendar has had last month. Clicking on the report icon ![]() will enable you to see a detailed view of the number of impressions for each news item or calendar event published on your app.
will enable you to see a detailed view of the number of impressions for each news item or calendar event published on your app.
Comments
0 comments
Please sign in to leave a comment.